
Part 3 - Microwave Imaging Inspection of Welded Joints in PE pipes
Microwave Imaging (MWI) inspection is unlike many other NDT techniques in that it is does not have a history of use for metallic materials, for which it is unsuitable, but has been specifically developed for polymeric materials based upon measurement and changes in relative permittivity. It uses a form of electro-magnetic radiation (EMR) in the microwave frequency range between 1GHz and 100GHz (Figure 1).
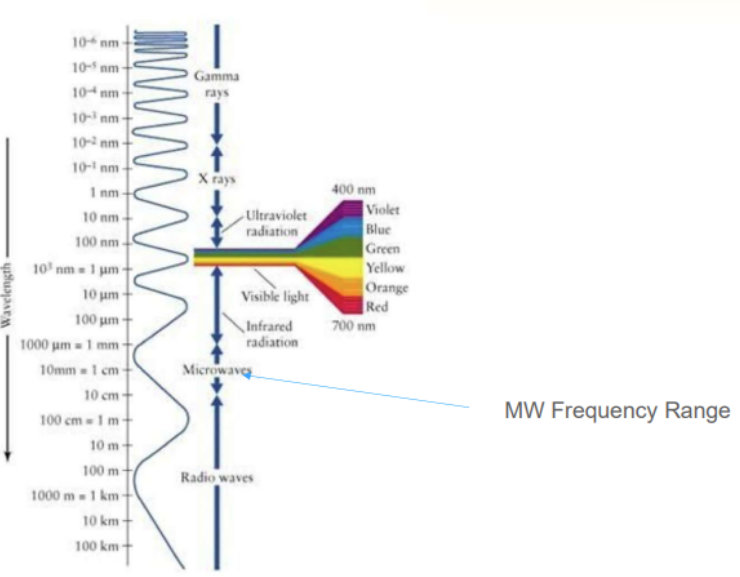
Figure 1. Position of microwaves used for inspection within the range of EMR
The use of MWI is for non-conductive, non-magnetic materials including polymeric materials, composites and ceramic materials. The process of inspection involves bathing the material under test with microwave energy of varying frequency and monitoring reflections returned with differing and complex permittivity. These reflections are a function of the interactions with the material under test and can be analysed to show differences where they occur. By this process, MWI can be used to identify voids, cracks, delamination, contamination and the integrity of thermoplastic welds and other flaws. There is a history of use of MWI since the 1960s and documentation of field inspection since the early 2000s.
The advantages of MWI versus other NDT techniques include:-
It is typically easier to set up, use and analyse than most other advanced systems;
No couplant (water or gel) is required and there is no mess to cleanup;
Microwave works well on materials that are normally difficult to inspect like fiberglass or rubber;
MI is safer than radiography with no special safety requirements and is as fast as UT.
Microwave inspection techniques have been used for several years to insect High-Density Polyethylene materials. ASTM E3101 was written to provide guidance in microwave inspection of HDPE butt-fusion welds (with ISO standard to follow). In addition, many papers have been written that show that the PE complex permittivity changes based on material crystallinity. The PE fusion process influences the material local complex permittivity, which allows the complex permittivity to be used to determine fusion quality.
A multi-frequency data acquisition system was used to collect microwave data. This data acquisition uses a Vector Network Analyzer (VNA). The VNA was calibrated via the Open, Closed, Load method and was set to collect complex data over a specified frequency range. A proprietary broadband inspection antenna was used to collect data at a 5-10mm spacing for the entire circumference (and length in the case of EF). Once the data is collected, the imaginary portion of the complex permittivity is examined.
Laboratory MWI Inspection of Butt Fusion Welds
Laboratory testing of butt fusion welds was undertaken using the same equipment that would be used in the field (Figure 2).
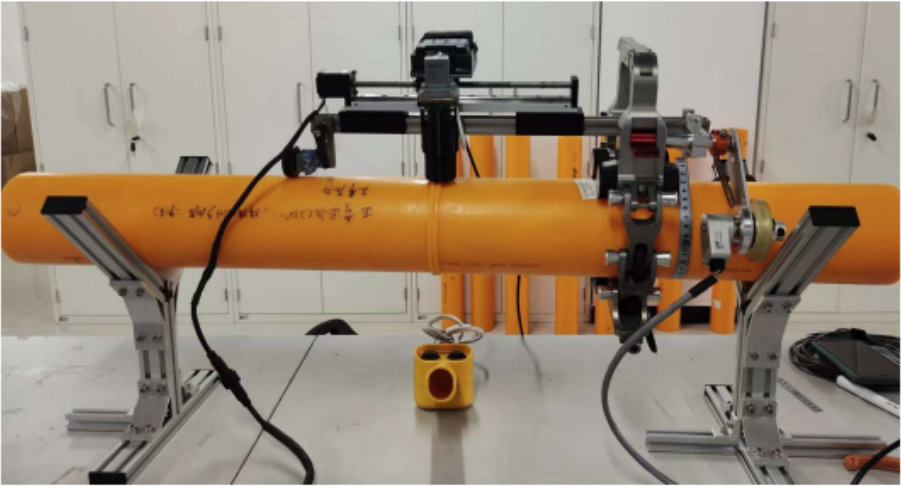
Figure 2. MWI Inspection of a butt fusion weld in the laboratory
A typical image of the resulting scan is given in Figure 3, with an indication of the layout of the C-scan image. A-scan and B-scan images are also provided within Figure 3.
The process of analysis involves the setting of time of flight (TOF) delay times for different portions of weld depth (Figure 4):
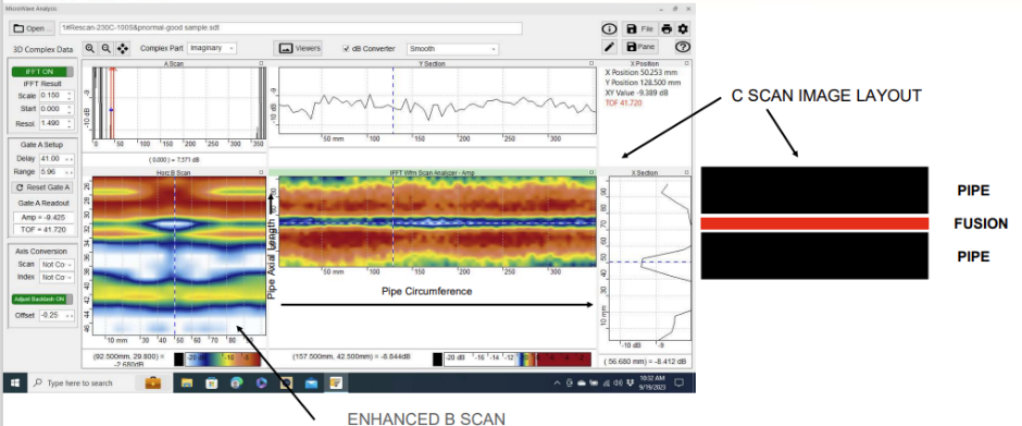
Figure 3. A typical PE BF weld scan image
The TOF (Time of Flight) delay times are determined visually during the initial part of the analysis. They are currently determined by the Level III inspector
The data and image at each time delay represents the cross section at some thickness around that depth layer
Note that the pipe OD delay is not zero due to antenna delay and the gap between the tip of the antenna and the pipe OD
TOF 3 and 4 are inside the fused region and should be representative of the fusion conditions
TOF 4 (or more) may be necessary for thick pipe sections
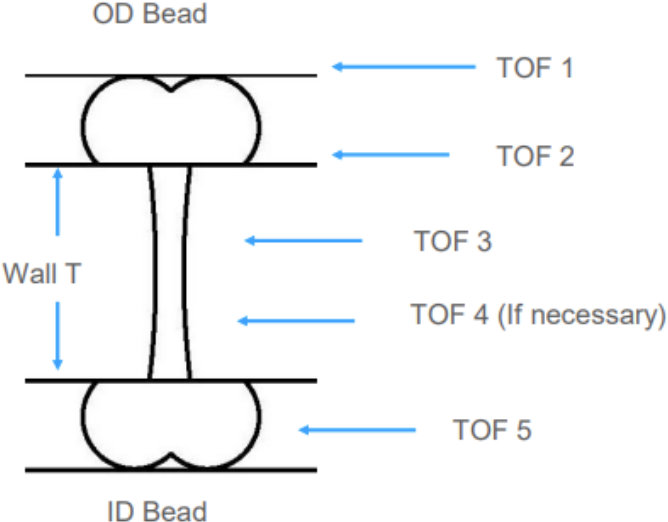
Figure 4. A typical HDPE Butt fusion cross section with outer bead and inner bead present
Once that these settings have been made the relevant portions of the scan can be identified as shown in Figure 5.
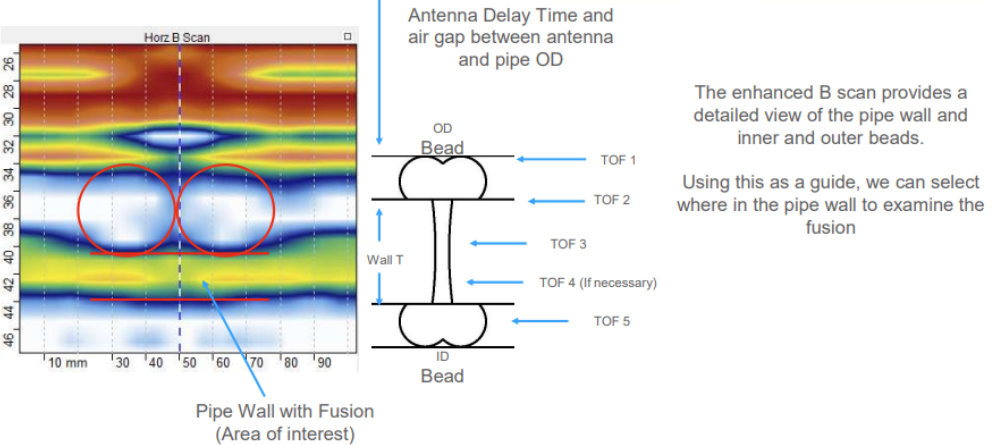
Figure 5. Illustration of the B-scan image as a function of TOF and sample thickness
A typical fusion analysis involves the setting an Accept/Reject criteria, which is established for the specific pipe size and ID by making welds using a similar pipe size and wall thickness as those being inspected. Ideally, the welds would consist of several known good and flawed samples, but the minimum requirement is to have the data of a good weld example as control. Typically, pass/failure criteria would be set within 1dB of the control sample either for the whole or large majority of the circumference (70-100%, criterion 1) or for each 10% section of the circumference (criterion 2).
This process was used to assess 8 welds with pre-determined levels of quality, with the results given in Table 1.
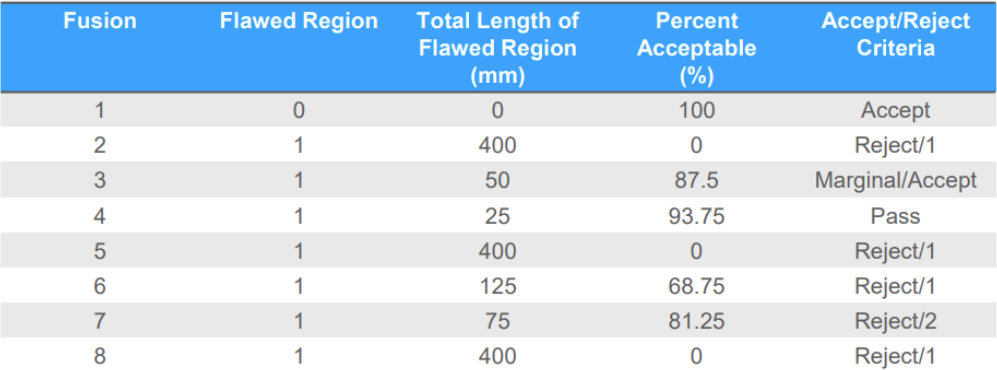
Table 1. Results of MWI Inspection of welds with pre-determined levels of quality
The results of the process show that using a multi-frequency microwave inspection method with improved cross-section depth ability increases the sensitivity of detection of minor changes in pipe fusion conditions. Sample 2 is an outlier due to the failure of the entire fusion after a minor change in heat soak time. The ability to review only the data in the fusion region without interference from the surface or inner bead results in more accurate evaluation of the quality of the fusion zone. The ability to inspect the entire fusion without removing the outer bead improves the inspection time and effort. MWI inspection could replace on-site pressure (leak) testing of the main where accepted by the owner and/or local jurisdictions.
Future work will focus on the inspection of a wider range of samples to establish firm accept/reject criteria and to validate inspection results with mechanical testing.
Laboratory MWI Inspection of Electrofusion (EF) Welds
The use of multi-frequency VNA technology has allowed microwave inspection to become an established method for complex composites, such as wind turbine blades. The same technology can also be applied to provide inspection of EF couplers. The method can be used to quickly and easily identify imperfections such as lack of fusion, contamination, improper insertion, voiding, and other flaws.
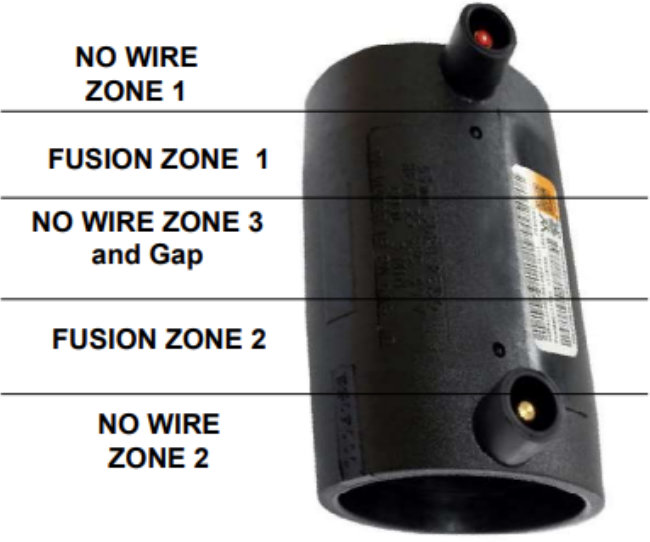
Figure 6. Explanation of the zones within an EF coupler
Electrofusion couplers have multiple zones once they have been fused (Figure 6). The zones that are labelled “No Wire ” are where no wires are present (hence no fusion) at each end of the coupler and in the middle (zone 3, between the two separate ends of pipe).
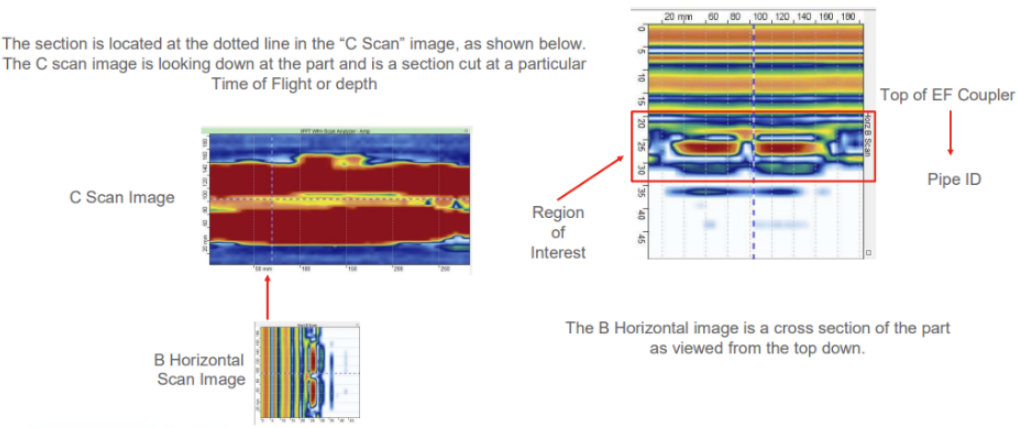
Figure 7. Location of the C-scan image of interest from the TOF/depth in the B-scan image
The location of the C-scan image required is from the top of the coupler to the pipe internal diameter (pipe ID) and this can be located from the B-scan image as shown in Figure 7. As the scanner progresses along the width of the coupler, each scan line is laid next to each other for the entire width of the coupling capturing each of the zones identified above in the expected C-scan image (Figure 8).
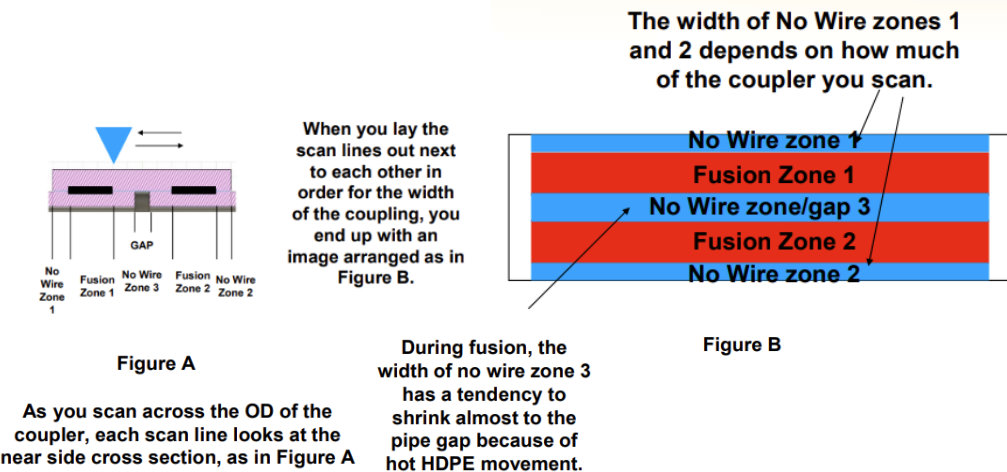
Figure 8. Explanation of how the expected image is derived
This expected C-scan image can be seen against the actual image obtained in Figure 9.
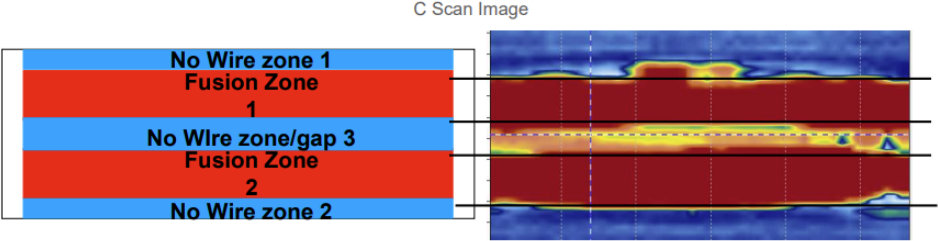
Figure 9. Expected C-scan image and actual image obtained for a good EF weld
This advanced method allows for a very simple approach to inspection and detection of flawed EF couplers. Once identified, flawed couplers can be removed from service and replaced before they cause problems. The following data set demonstrates the simple task of discriminating flawed joints from acceptable joints. The set of couplers was inspected on a blind basis so the exact nature of the flaw is not known (Figures 10-14).
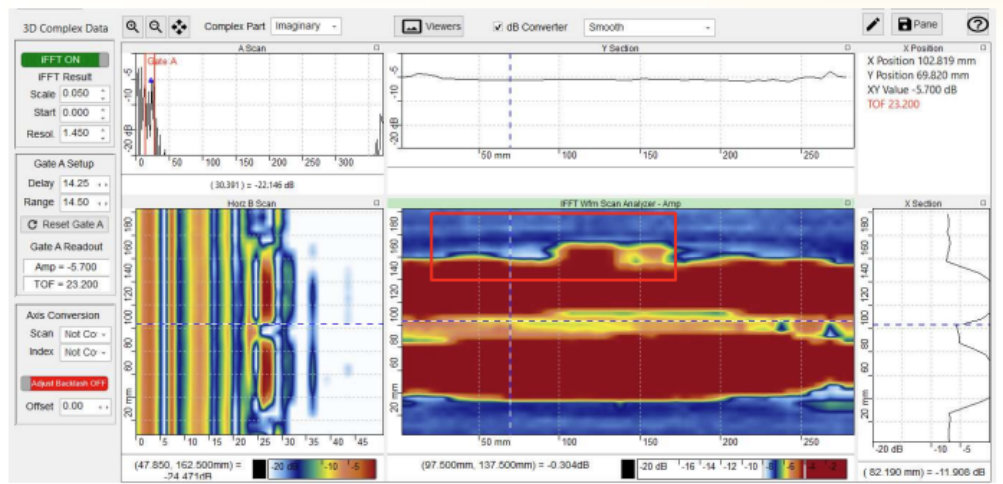
Figure 10. Example 1 – minor flaw at the edge of the coupler
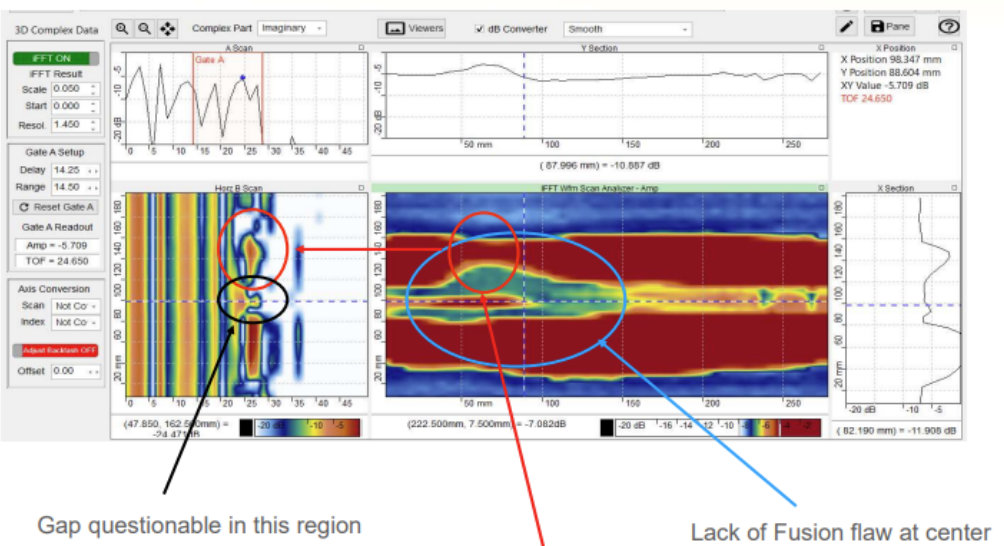
Figure 11. Example 2 – major flaw – thin fusion zone
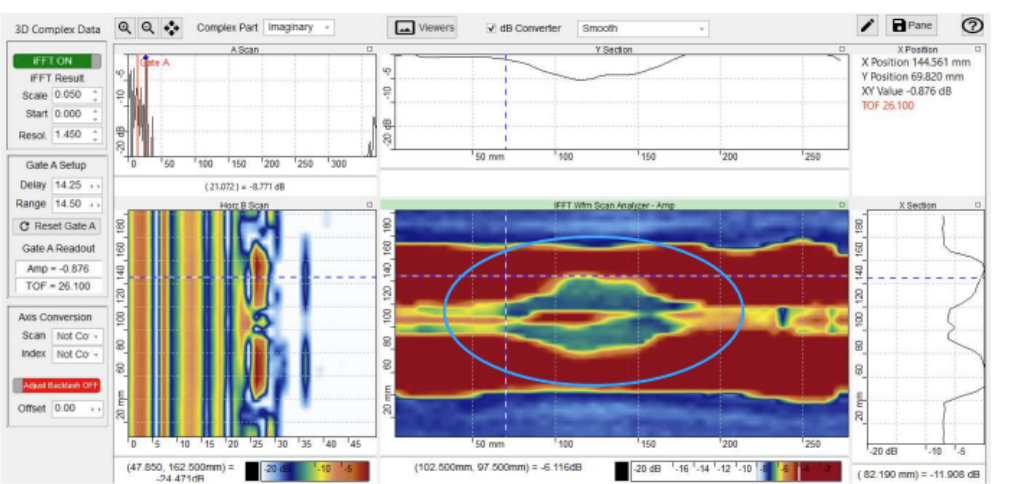
Figure 12. Example 3 – major flaw – poor fusion in the centre
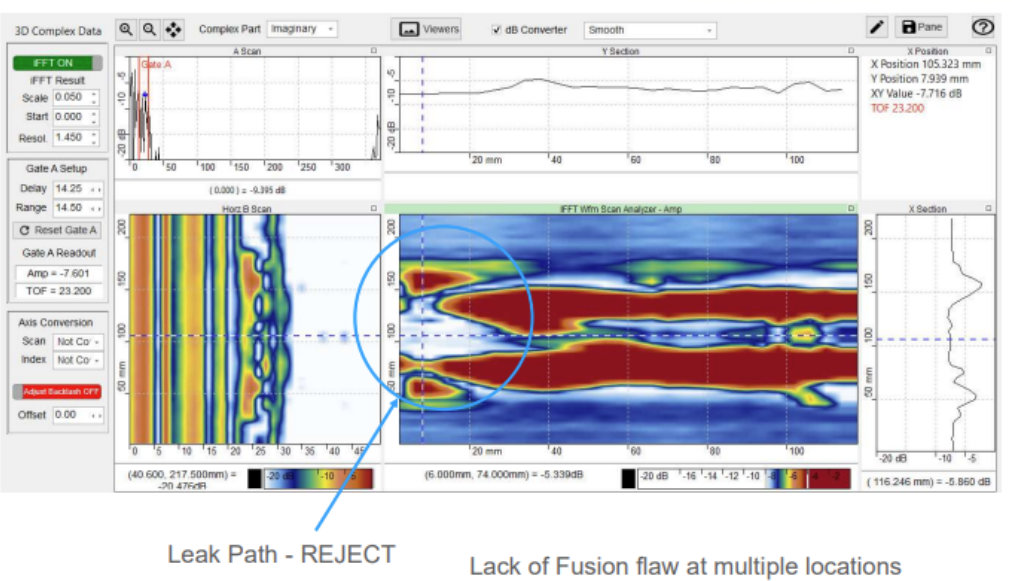
Figure 13. Example 4 – major flaw – general lack of fusion and leak path identified
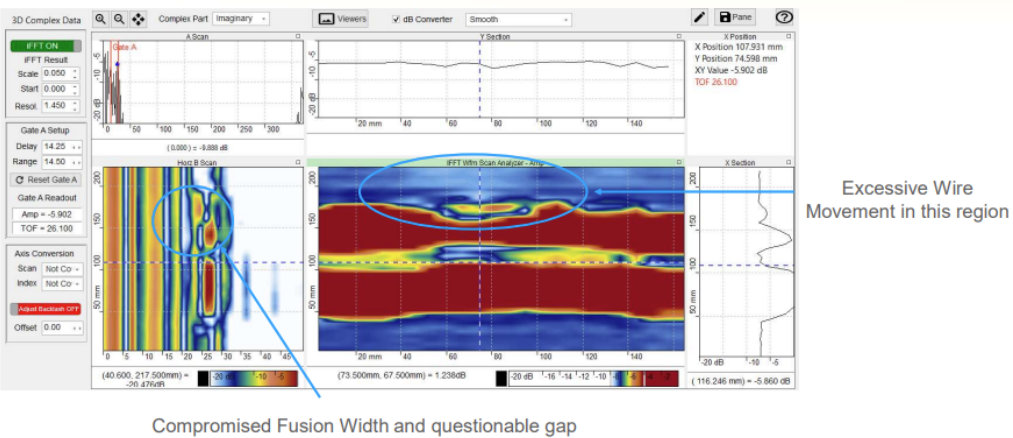
Figure 14. Example 5 – major flaw – low fusion width and excessive wire movement
The conclusion of the work on MWI inspection of EF couplers is that it has been shown that using a multi-frequency microwave inspection system and advanced data analysis software provides detailed cross sectional information for PE EF Couplers. This information simplifies the identification of flaws, with detailed visual C-scan images. The system requires no couplant and data collection is rapid, for example: data may be obtained in 10-15 minutes for 8 Inch (200mm) diameter EF couplers.
Part 1 - NDT of Fusion Welded Joints in PE100 Pipe
Part 1 Non-Destructive Testing of Fusion Joints of PE100 Pipes and Fittings The integrity and performance of PE100 pipelines are significantly influenced by the quality of their joints. The most prevalent methods for joining these pipes are butt fusion joining and electrofusion joining . Butt fusion joining is widely favored for its ability to create strong, continuous connections by heating the pipe ends and pressing them together to form a monolithic joint. Variants in butt fusion...
Part 2 - Phased Array Ultrasonic Inspection of Welded Joints in PE pipes
TWI has been carrying out research and development on non-destructive testing (NDT) using volumetric inspection techniques required for welded joints in PE pipes since the 1980s [12-22], which has culminated in the PolyTest phased array ultrasonic testing (PAUT) system ( www.polytestsystem.com ). The following description is based upon this particular system of PAUT. Conventional ultrasonic inspection uses a single piezoelectric element probe to send ultrasonic waves, typically at frequencies...
Part 4 - Independent Review of NDT of Fusion Welded Joints in PE100 Pipe
It has been established that NDT techniques can be successful in detecting flaws within fusion welded joints, but independent scrutiny is required to establish to what extent the flaws detected are significant in terms of performance of the joints. This can only be established by comparison of results of NDT analysis with destructive mechanical testing currently specified to identify satisfactory performance of the joints. A number of studies have been identified where controlled...
Members of the Association
